Gray Scalable's 3rd annual start-up recruiter survey
Welcome to our third year of survey results! In our 2016 survey, we asked recruiters specifically about their talent acquisition practices. The following year, we added in a section to ask about HR operations like engagement surveys, compensation and performance reviews. This year, we added a few new questions to each section, combined the data points, and were able to take a first look at some interesting trends over time.
Our Survey Takers
Participants. 157 start-up recruiters over three years participated in our survey - a little over 50 each year have participated. The results below will be a combination of the three years unless otherwise noted. We recognize that there will likely be a few recruiters who have taken this more than once - but since start-ups grow quickly in size and scale their HR processes to match, what the company reports from one year to the next will likely reflect two very different companies, so we opted to report all the results together.
Locations. The majority of the start-ups were based in New York (68%), another 15% came from Northern California, 7% came from London, and the remaining 10% were spread out among other countries and US cities
Start-Up Size. The companies were evenly spread out among company size, with 20 or so responses from each category:

Building Recruiting Functions
Number of Recruiters. This year we looked at how many recruiters each start-up had as a function of company size. Check out the below animation -
When to add the second (or third, or more) recruiters will also depend on how quickly the company is growing and the types of roles you need to fill.
Recruiting Coordinators. We found that recruiting coordinator support grows as the number of recruiters does -


The graph on the left shows the number reporting one (or more) recruiting coordinators. The graph on the right is the same graph but it starts to show where multiple recruiting coordinators are added. Overall, once a second or third recruiter is added, it’s likely that recruiting coordinator support goes along with it. Once there are four or more recruiters, we start to see the emergence of multiple recruiting coordinators. It looks like the ratio is every two or three recruiters needs recruiting coordinator support.
Recruiters years of experience. As we’ve found in years past, start-up recruiters are not new to the job. It’s unlikely to see recruiters who have less than two years of experience, and 63% of recruiters have at least six years of experience in their role -

For companies where there was only one recruiter at the start-up, the number of recruiters with more than ten years of experience jumps to 40%, suggesting it’s best to have someone who knows the ropes start your recruiting operations.
Number of Jobs at One Time. Most recruiters reported being responsible for 6-10 roles at any given time (53%) or 11-20 (24%). It was rare to have more than 20 roles at a given time (6%) or fewer than 5 (18%).
Time to Fill. Both tech and non-tech recruiters reported taking 1-2 months to fill a role (48%) or 3-4 months (30%). The remaining 21% reported taking a month or less on average to fill a role. However, recruiters who were responsible for more than 10 roles at once were much more likely to report taking 2 or more months to fill a position than those who had fewer than ten roles.
Recruiting Operations
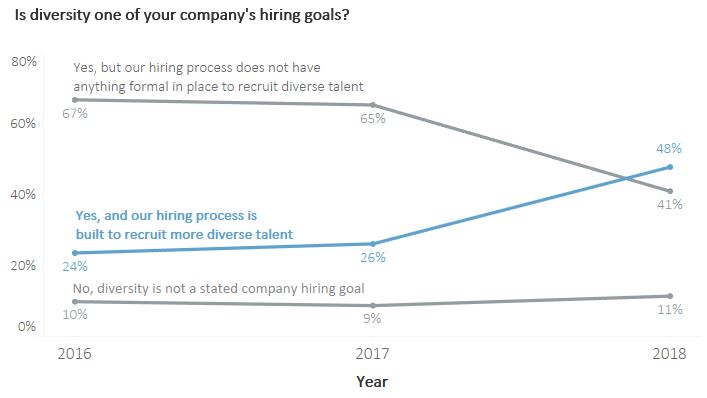
Diversity. Each year we’ve asked whether diversity is a company hiring goal, and asked recruiters to report whether there is anything formal in place to recruit a more diverse pool of candidates. In the first two years, there wasn’t much change, but this year we saw an uptick in the number of recruiters reporting that they have put formal measures in place to recruit more diverse talent. The number of recruiters reporting that diversity is not a stated goal has held steady at about 1 in 10 start-ups.
While we didn’t ask companies to tell us what measures they were taking to recruit more diverse talent, we know there are a lot of options out there - de-biasing job descriptions, unconscious bias training and participating in organizations that support diverse candidates are just a few ways we’ve seen companies take action.
ATS Usage. Similar to other years, Greenhouse was the most used ATS among start-ups (67% of responses). Jobvite, Lever and Workable reported 5% or more each. And this year we also saw the emergence of Hire by Google being used by start-ups, which launched last summer.
Structured Interviews. We asked recruiters to report whether they a structured interview process (consistent topics and questions across interviews). Year over year, about 80% report using structured interviews, which is great, as structured interviews combat bias and are better predictors of future job success compared to unstructured interviews.
Skills Tests. This year we noticed an increase in the number of start-ups requiring skills tests for all of their roles (compared to just for select roles like engineering) -

In addition to structured interviews, skills tests are also good predictors of job performance so the two in combination are hopefully yielding more successful hires for the companies that use reported using them in our survey.
Interview Training. Just over 60% of start-up recruiters reported that their companies had interview training provided for at least hiring managers (if not the whole company). This has remained consistent across three years -

Since structured interviews and skills tests are good predictors of on-the-job success, training your hiring teams to be methodical and consistent in the interview process is a great way to make sure everyone is on the same page.
Candidate Sourcing Tools. We ask recruiters to identify the three most used tools to source candidates -

Linkedin has remained the number one tool among all recruiters, and Entelo, AngelList and Hired.com seem equally used among tech and non-tech recruiters. Stack Overflow, Underdog.io and Github (the latter two not pictured in the graph above) were more common among tech recruiters.
Employee Referral Programs. A new question this year is whether companies have a formal employee referral program. The large majority (88%) reported that they did. We also learned many interesting things about how they are built -
Type of Award. The vast majority give out cash awards, but some companies reported other ways of rewarding employees, with some giving a donation to charity and others putting money toward employee travel.
How Amounts are Determined. It was most common for companies to give the same amount of cash for all referrals, but we also saw a quarter of companies report differentiating by role (mostly giving out higher awards for technical positions relative to operations) and a few companies reporting differentiating by level (mostly director and above having larger awards than more junior hires).
Referral Bonus Amounts. For those offering cash, the referral bonuses varied. The most common amounts were in the $1,000 - $3,000 range -

If a company paid more for tech (or higher level) roles, it was usually about double. For example, most companies paying $2,500 for a non-tech role reported paying $5,000 for a tech role.
HR Practices
Engagement Surveys. 78% of recruiters reported that their company has conducted employee engagement surveys. The size of the company doesn’t seem to matter - companies with fewer than 50 employees were just as likely to report using engagement surveys compared to larger start-ups. The most popular tools were Culture Amp (45% of those who conduct surveys), SurveyMonkey (26%) and Google Forms (19%).
Employee Performance Cycle. We asked participants how many times a year employee performance is reviewed. Over 80% of start-ups reported reviewing employee performance at least once a year (with the remaining 20% not reporting any review). Of those who do review employee performance, the most common timing was twice per year (53%), followed by annually (26%) and quarterly (21%).
Performance Ratings. Of the start-ups with a performance review process, 30% did not employ performance ratings. Of the 70% that did, a five point scale was the most popular (41%), followed by a four point scale (35%), and a three point scale (24%).
HRIS Tools. We asked participants to report what HRIS they used at their company. The most common (ones with 10% or more each) were the platform provided by their PEO, ADP, BambooHR and Namely.
HR Reporting Structure. A new question we asked this year is who the Recruiting function and HR function reports to at the company. Most commonly, recruiting reports up through HR, and HR reports up through the CEO.

Compensation Data. In 2017, 68% of start-ups in our survey reported using a compensation consultant or market survey data to inform their pay practices. The number is higher this year - 79% reported using market compensation data. The increase could partially be a result of the new law that went into effect in late 2017 in New York and California that prevents companies from asking candidates salary history during the interview process. Since most companies in our survey are no longer able to anchor an offer in what someone was previously making, having market data to turn to makes the offer process easier (and more fair!).
written by Sam Feldman, Head of People Analytics
--
Thank you to all the recruiters who took our survey this year! If you have questions or suggestions, email Sam Feldman - sam@grayscalable.com.
Follow us to be the first to know about next years' survey!